
Figure 3. TZDs target the cancer stem cell population of osteosarcomas.
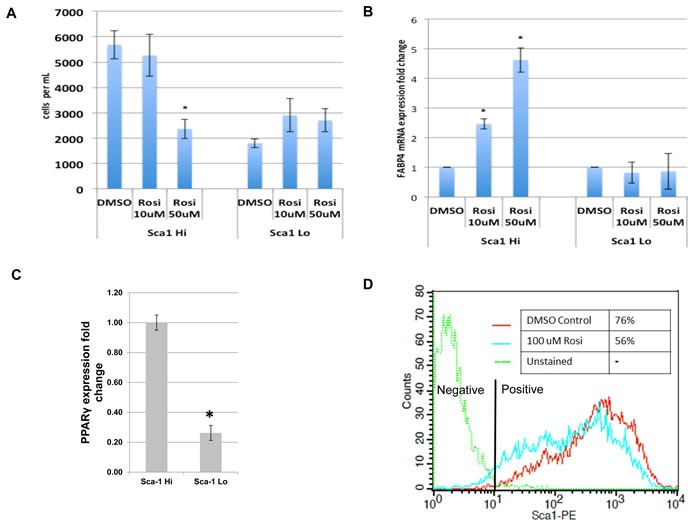
mOS-482 cells were fractionated into Sca-1High and Sca-1Low fractions by fluorescence activated cell sorting (FACS). The two fractions were treated with 50 or 100 uM Rosiglitazone (Rosi), and A., cell proliferation and B., expression of adipocyte-marker FABP4 by qRT-PCR, were measured. C. Relative fold change in mRNA expression of PPARγ measured by qRT-PCR relative to actin as a control. D. Flow cytometric analysis of membrane Sca-1 expression of phycoerythrin-labeled (Sca-1-PE) mOS-482 cells before and after treatment with 100 μM Rosi for 72 hours. The histogram shows mean fluorescence intensity of the indicated cells. Y axis is maximum mean fluorescence intensity. X axis is IgG-phycoerythrin stained cells (-phycoerythrin-conjugated - anti Sca-antibody).