
Figure 2. B1 progenitors (B1P) and colony forming units (CFU) analysis.
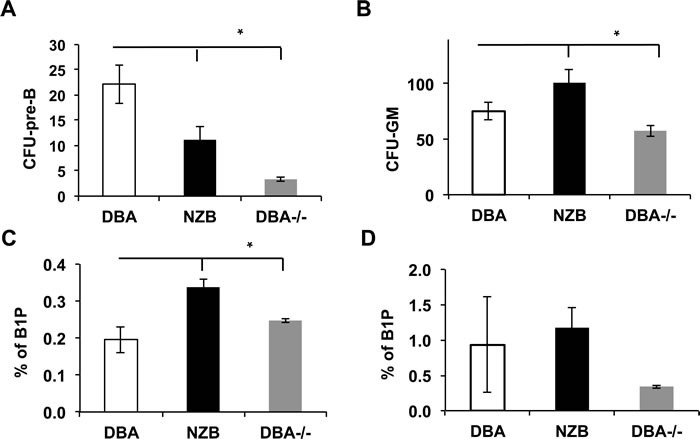
A. Pre-B CFU assay for bone marrow cells derived from the indicated mouse strains; B. CFU-GM assay of bone marrow cells derived from the indicated mouse strains. Columns are means and bars are SEMs. Asterisks represent statistical difference (p < 0.05). C. Flow cytometry quantitative analysis of B1 progenitors in the spleen of the indicated mouse strains (age = 12 months, n = 3); columns represent means and bars are SEMs. D. Flow cytometry quantitative analysis of B1 progenitors in the bone marrow of the indicated mouse strains (age = 12 months, n = 3); no statistical difference observed. B1 progenitors were defined as Lin−AA4.1+CD19+B220neg/dull population.