
Figure 5. Quantitative PCR analysis of in vitro differentiated NZB ES/iPS cells.
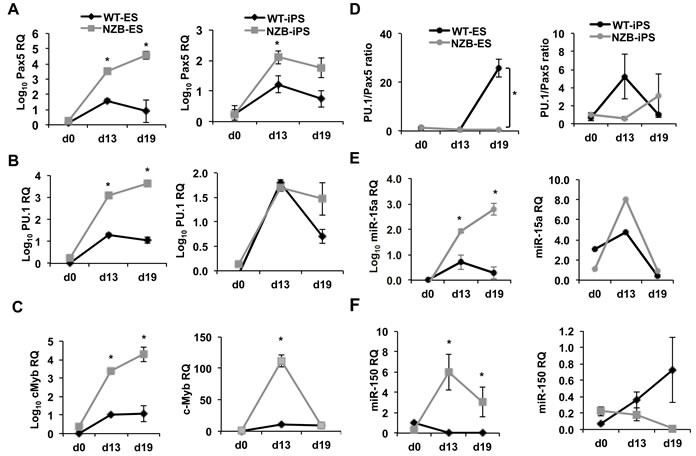
The expression levels of A. Pax5, B. PU.1, C. cMyb, D. miR-15a, E. miR-150 in ES (left panels) and iPS (right panels) cells during in vitro differentiation. F. The calculated ratios of PU.1 to Pax5 expression in ES (left) and iPS (right) cells. Relative quantification (RQ) and log10 RQ are indicated on the axes; n = 3, p < 0.05 is considered significantly different from the previous time point and marked with an asterisk. ES and iPS cells were pre-differentiated as embryoid bodies for 7 days and plated in semisolid pre-B methocult medium for 12 days. qPCR assays were performed using SYBR green master mix and custom primers for protein coding gene transcripts. First strand cDNA synthesis was performed by using SuperScript First-Strand Synthesis System (Invitrogen) using oligo-d(T)n. MicroRNA measurements were done using TaqMan assays for mmu-miR-15a and mmu-miR-150. TaqMan assay for U6 was used as a housekeeping control.