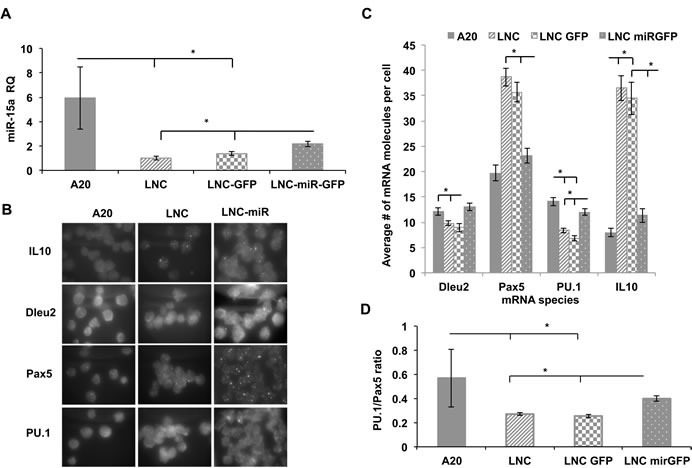
Figure 6. Gene expression analysis of NZB B cell line (LNC) transduced with miR-15a lentiviral construct.

Four cell lines including the non-NZB B cell line A20, the NZB cell line, LNC and two sublines of LNC which had been transduced with a lentivirus containing GFP (LNC-GFP) or LNC transduced with a lentivirus containing both GFP and miR-15a/16 (LNC-miR-GFP) were studied:. A. Quantitative PCR TaqMan assay for mir-15a levels in LNC cells lentivirally transduced with wild type mir-15a construct in comparison to non-transduced and non-NZB cells; B. Representative RNA FISH microscopy images of individual transcripts. The slides were imaged using probes specific to Pax5, PU.1, Dleu2 and IL-10 RNA molecules; C. Quantitative analysis of RNA-FISH data to obtain average number of specific mRNAs per cell. At least 100 cells were analyzed; D. Calculated PU.1 to Pax5 expression levels ratio. Each cell was simultaneously probed for both PU.1 and Pax5 and the ratio was determined; n = 3, asterisks represent statistically significant difference (p < 0.05).
