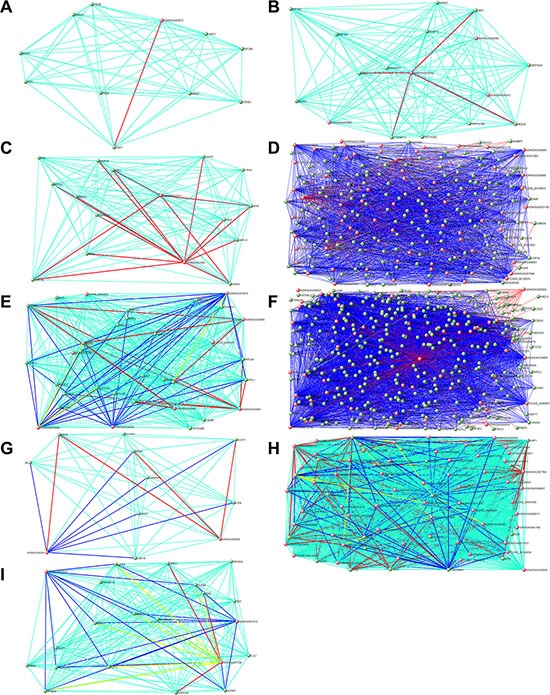
Figure 6. Hub gene networks for human stage-specific modules.

Visualization of gene-gene interactions within each module. The connections were drawn using the VisANT tool. The genes with at least one connection when the weighted cutoff value was ≥ 0.1 are shown. Each node represents a hub gene. The red nodes are hub lncRNAs. The green edges mean co-expression, and the red edges mean both co-expression and interaction, and the blue edges mean both co-expression and neighbor gene, and the yellow edges mean all three situation (co-expression, interaction and neighbor gene). To make the background clear, the green edges are not shown in Figure D and F. (A) Black module. (B) Brown module. (C) Green module. (D) Greenyellow module. (E) Magenta module. (F) Pink module. (G) Red module. (H) Salmon module. (I) Yellow module.
