
Figure 2. O-GlcNAcylation is associated with gastric cancer cell proliferation in vitro.
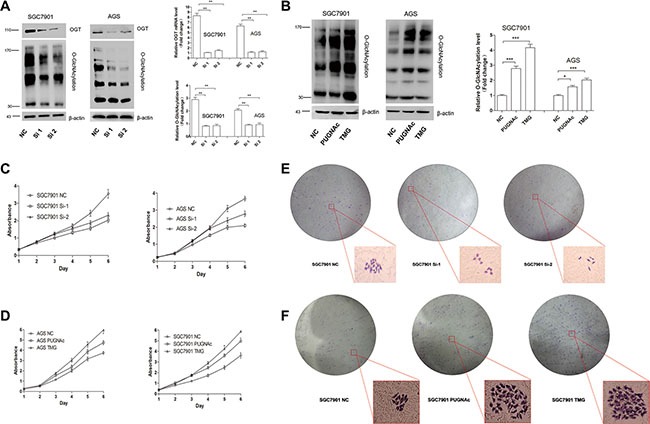
(A) The expression of OGT and total O-GlcNAcylation level of SGC 7901/AGS cells 72 hours after transfection with NC (negative control), OGT siRNA 1 (Si-1) and Si-2 were determined by an immunoblotting assay. β-actin was used as a loading control. The mean level of OGT or O-GlcNAcylation from three independent experiments is shown on the right. The values shown are expressed as the means ± SEM. (B) The total O-GlcNAcylation expression level of SGC 7901/AGS cells after 12 hours of treatment with PUGNAc (100 μmol/L), Thiamet-G (10 μmol/L) or isometric DMSO (negative control, NC) were determined by an immunoblotting assay. β-actin was used as a loading control. The mean level of O-GlcNAcylation from three independent experiments is shown on the right. The values shown are expressed as the means ± SEM. (C, D) The effect of O-GlcNAcylation on the proliferation rate of SGC 7901/AGS cell lines. The effect on cell proliferation was assessed over 6 days using the cell counting kit-8 assay. The OD450 value is expressed as the mean ± standard deviation. * represents Student's t-test *P < 0.05, **P < 0.01 and ***P < 0.001. (E, F) Effect of O-GlcNAcylation on the clone formation ability of the SGC 7901 cell line. One thousand cells were incubated in 6-well plates for 14 days.