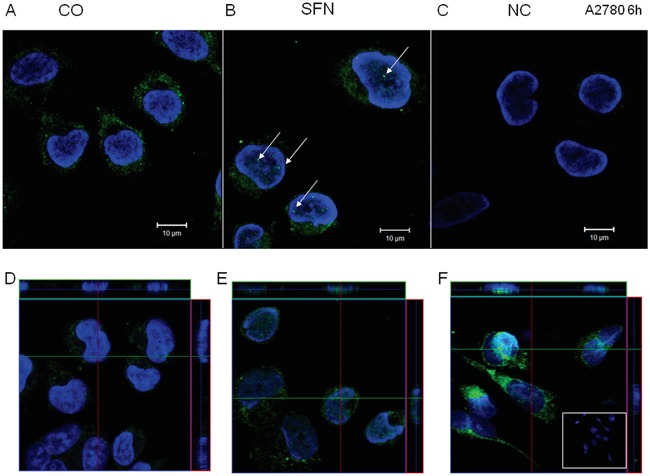
Figure 9. IP3R1 immunofluorescence of control (A, D) and SFN-treated (B, E) A2780 cells.

IP3R1 was localized in the endoplasmic reticulum in control cells and partially translocates to the nuclei in SFN-treated cells (B; white arrows). In order to show that IP3R1 are really in the nuclei, we performed z-stacks from control D. and SFN-treated E. cells. Orthogonal views D, E, F. give a middle plane of z-stacks crossing the nuclei and also xz and yz sections through the entire thickness of cells along green and red lines, clearly showing presence of the IP3R1 signal (E) and also signal for ER marker - calnexin F. within nuclei in SFN treated cells. Signal was not observed in control, non-treated cells (D). As a negative control (C), cells were treated only with the secondary antibody. Nuclei stained by DAPI are shown in blue.
