
Figure 1. YM155 sensitizes Caki cells to TRAIL-mediated apoptosis.
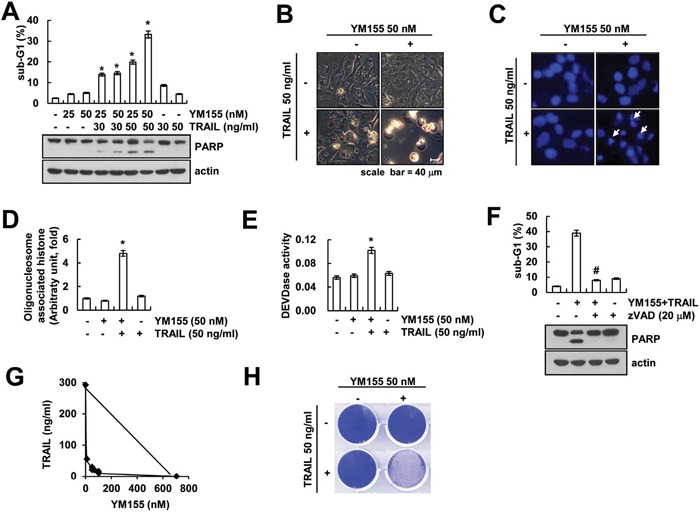
A. Caki cells were treated with the indicated concentrations with TRAIL in the presence or absence of the indicated concentrations of YM155 for 24 h. The sub-G1 fraction was measured by flow cytometry as an indicator of the level of apoptosis. The protein expression levels of PARP and actin were determined by western blotting. The level of actin was used as a loading control. B-E. Caki cells were treated with 50 ng/ml TRAIL in the presence or absence of 50 nM YM155 for 24 h. The cell morphology was examined using interference light microscopy (B). The condensation and fragmentation of the nuclei were detected by 4′,6′-diamidino-2-phenylindole staining (C). The cytoplasmic histone-associated DNA fragments were determined by a DNA fragmentation detection kit (D). Caspase activities were determined with colorimetric assays using caspase-3 (DEVDase) assay kits (E). F. Caki cells were treated with 50 nM YM155 plus 50 ng/ml TRAIL for 24 h in the presence or absence of 20 μM z-VAD-fmk (z-VAD). The sub-G1 fraction was measured by flow cytometry. The protein expression levels of PARP and actin were determined by western blotting. The level of actin was used as a loading control. G. Isoboles were obtained by plotting the combined concentrations of each drug required to produce 50% cell death. The straight line connecting the IC50 values obtained for the two agents when applied alone corresponded to the addition of their independent effects. Values below this line indicate synergy, whereas values above this line indicate antagonism. H. Effect of combined treatment with YM155 and TRAIL on long-term survival. Caki cells were treated with 50 ng/ml TRAIL in the presence or absence of 50 nM YM155. Clonogenic survival was determined by staining colonies with crystal violet and visualized with 0.4% coomassie blue by a digital camera. The values in panel (A, D, E and F) represent the mean ± SD from three independent samples. * p < 0.05 compared to the control. # p < 0.01 compared to the combined treatment with YM155 and TRAIL.