
Figure 6. Effect of YM155 plus TRAIL treatment on apoptosis of other carcinoma cells and normal cells.
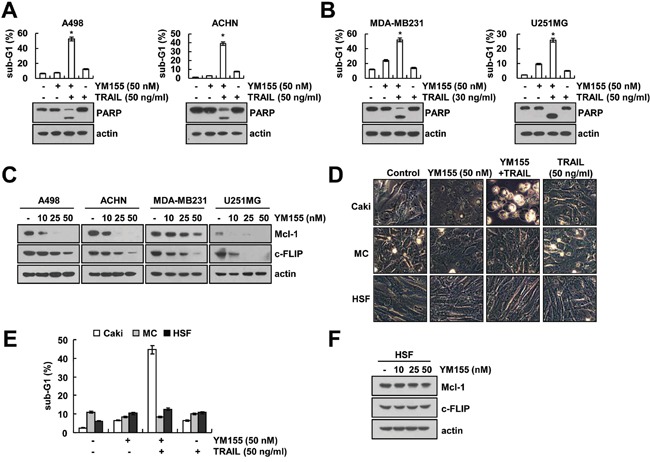
A and B. Renal carcinoma (A498 and ACHN), breast carcinoma (MDA-MB231), and glioma (U251MG) cells were treated with 30 or 50 ng/ml TRAIL in the presence or absence of 50 nM YM155 for 24 h. The level of apoptosis was assessed by measuring the sub-G1 fraction using flow cytometry (upper panel). The protein levels of PARP and actin were determined by western blotting. The level of actin was used as the loading control (lower panel). C. Cancer cells were treated with the indicated concentrations of YM155 for 24 h. The protein levels of Mcl-1, c-FLIP and actin were determined by western blotting. The level of actin was used as the loading control. D and E. Caki, mesangial cells (MC) and HSF cells were treated with50 ng/ml TRAIL in the presence or absence of 50 nM YM155 for 24 h. The cell morphology was examined using interference light microscopy (D). The level of apoptosis was assessed by measuring the sub-G1 fraction using flow cytometry (E). F. HSF normal cells were treated with the indicated concentrations of YM155 for 24 h. The protein levels of Mcl-1, c-FLIP and actin were determined by western blotting. The level of actin was used as the loading control. The values in panel (A, B and E) represent the mean ± SD from three independent samples. * p < 0.05 compared to the control.