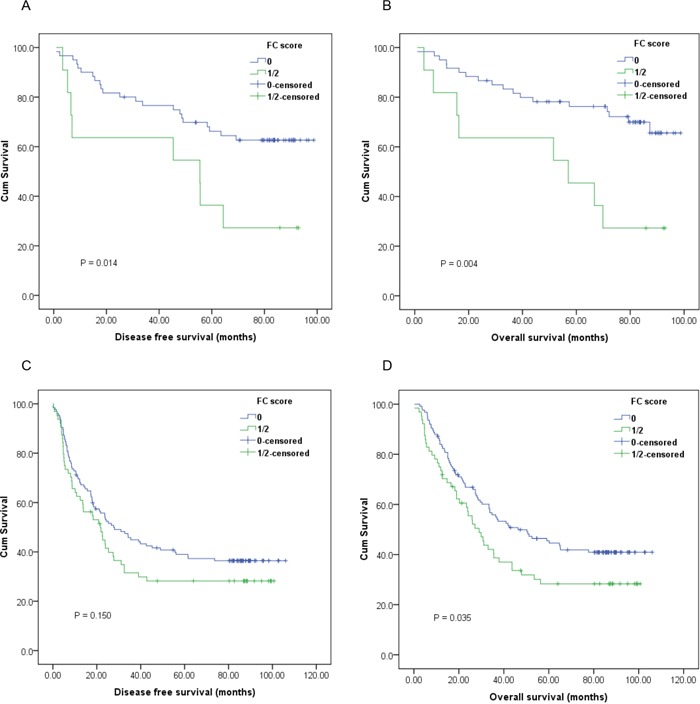
Figure 2. Kaplan-Meier survival curves of.

A., DFS and B., OS stratified by preoperative FC score in T1-2 stage ESCC patients (n=71); C., DFS and D., OS stratified by preoperative FC score in T3-4 stage ESCC patients (n=189) (with log-rank test).

A., DFS and B., OS stratified by preoperative FC score in T1-2 stage ESCC patients (n=71); C., DFS and D., OS stratified by preoperative FC score in T3-4 stage ESCC patients (n=189) (with log-rank test).