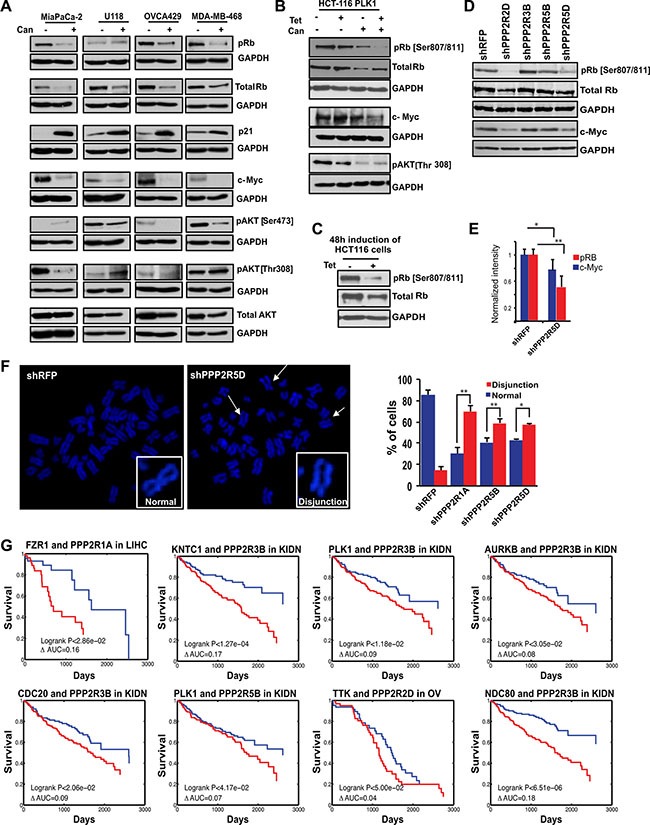
Figure 6. Identification of the PP2A regulatory subunit required for the survival of cancer cells and its clinical significance.

(A) Western blot analysis of naturally PLK1-overexpressing cancer cell lines in response to PP2A inhibition by cantharidin treatment. Levels of pRb (Ser 807/811), p21, c-Myc, pAKT (Ser473 and Thr308), and total AKT are represented with GAPDH as a loading control for MiaPaCa-2 pancreatic cells, U118 glioblastoma cells, OVCA429 ovarian cells, and MDA-MB-468 breast cancer cells. (B) Western blot analysis of HCT116-PLK1 uninduced and PLK1-induced cells after 24 hours with and without cantharidin treatment. Levels of pRb, total Rb, c-Myc, and pAKT [Thr308] are shown, with GAPDH used as a loading control. (C) Western blot analysis of pRb and total Rb in HCT116-PLK1 cells after 48 hours of induction. GAPDH is used as a loading control. (D) Western blots showing pRb, total Rb, and c-Myc in knockdowns of Class I PP2A subunits in MiaPaCa-2 cells. (E) Bar graph quantification showing the decrease in pRb (red) and c-Myc (blue) levels from (D). *p < 0.05; **p < 0.005. (F) Representative metaphase spread pictures for shPPP2R5D and shRFP and bar graph quantification for the PPP2R1A, PPP2R5D, and PPP2R5B knockdowns in HCT116-PLK1 cells relative to the non-targeting shRFP control, with the percentage of cells displaying chromosome disjunction shown in red and the percentage of cells with normal chromosome alignment shown in blue. (G) Kaplan-Meier survival curves of patients which have a naturally occurring SAC-PP2A SDL interaction, in blue, and those who do not, in red. *p < 0.05; **p < 0.005.
