
Figure 3. Circle plot illustrating co-mutations between genes found in HNSCC samples.
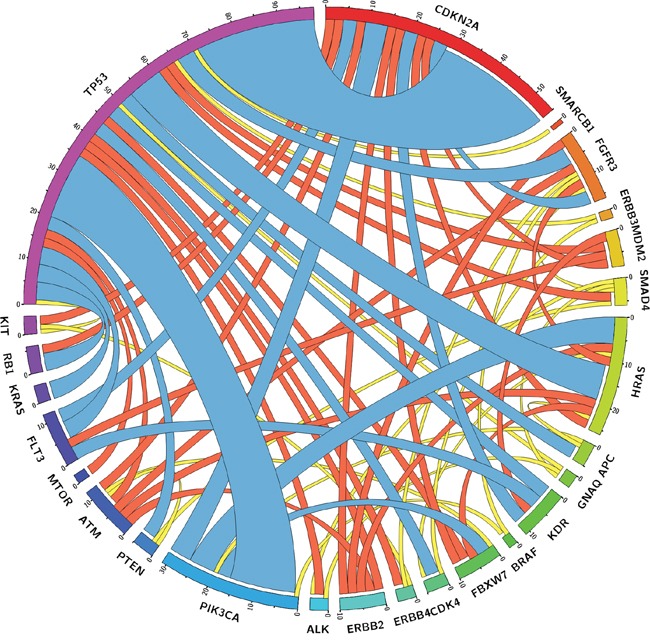
Outer bars showing the absolute total amount of co-mutations found for genes entitling the bars. The curved ribbons inside the circle depict absolute number of co-mutations with the genes they are connected with (ribbon thickness corresponds with number of co-mutations). Ribbons are color coded by quartiles Q1 (yellow), Q2 (red), and Q3 (blue).