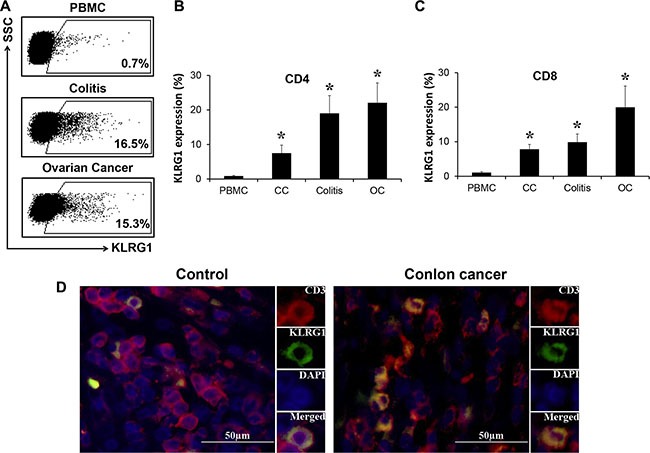
Figure 1. KLRG1+ T cells enriched in tumor microenvironment.

(A) KLRG1 expression on T cells from PBMC of healthy donors and T cells isolated from ovarian cancer and colitis tissue analyzed by flow cytometry. One of 8 representative data was shown. (B, C) KLRG1 expression on CD4 (B) and CD8 (C) T cells in colon cancer (CC), colitis and ovarian cancer (OC) by flow cytometry. n = 10, *p < 0.05. (D) KLRG1 (green) expression on CD3 (red) T cells in tissues from colon cancer patients and patients received colectomy after trauma by immunofluorescence staining. One of 4 representative data was shown.
