
Figure 5. si-CD73 inhibits HNSCC tumor growth and suppress EMT in vivo.
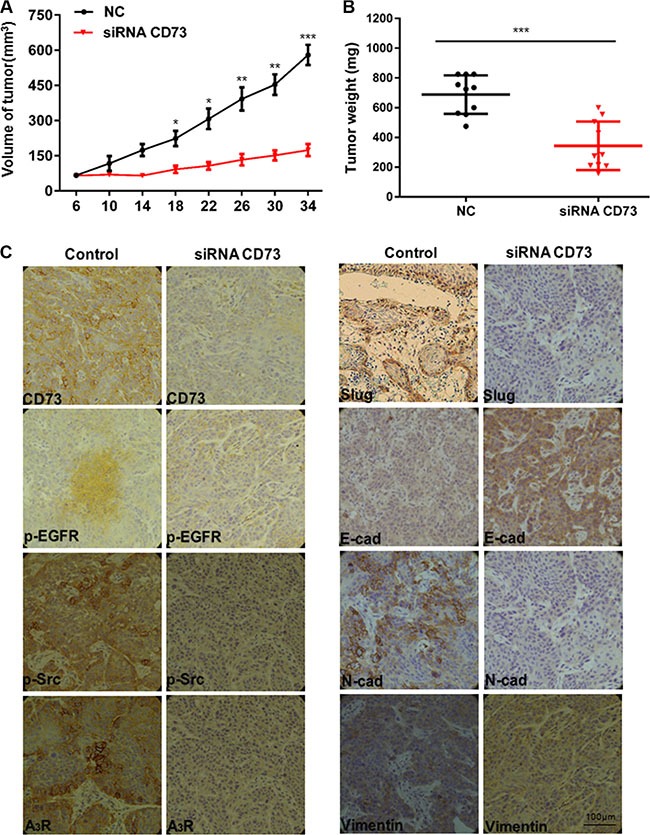
(A) Tumor growth curve of siRNA-CD73 mice and control mice. Data represent the mean ± SEM. of eight mice in each group. *P < 0.05, **P < 0.01, ***P < 0.001 by the Student's t-test; (B) Dissected tumors were photographed. The tumor volume and weight were measured. ***P < 0.001 by the Student's t-test; (C) Representative images of immunohistochemical analysis of CD73, p-EGFR, p-Src, A3R, Slug, E-cad, N-cad and Vimentin in tumors, (Scale bars = 100 μm).