
Figure 2. Manhattan plot of 19,571 SNPs of Notch pathway genes in the PLCO study.
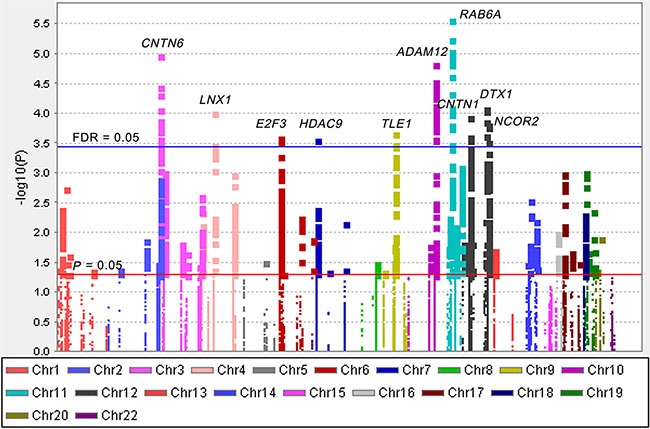
The statistical values across the autosomes for associations between 19,571 SNPs and overall survival are plotted as −log10 P values. The red horizontal line indicates P = 0.05 and the blue line indicates FDR = 0.05.