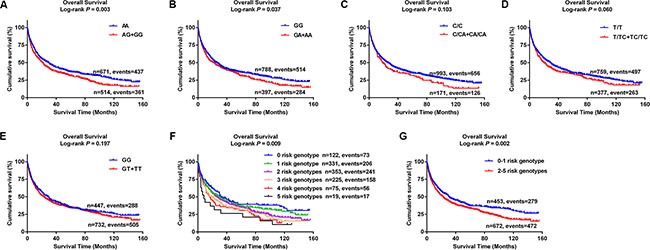
Figure 5. Kaplan-Meier (KM) survival curves for NSCLC patients of five tagSNPs and combined risk genotypes.

(A) ADAM12 rs10794069; (B) DTX1 rs1732793; (C) TLE1 rs199731120; (D) TLE1 rs35970494; (E) E2F3 rs3806116; (F) Six groups of combined risk genotypes; (G) Two groups of combined risk genotypes.
