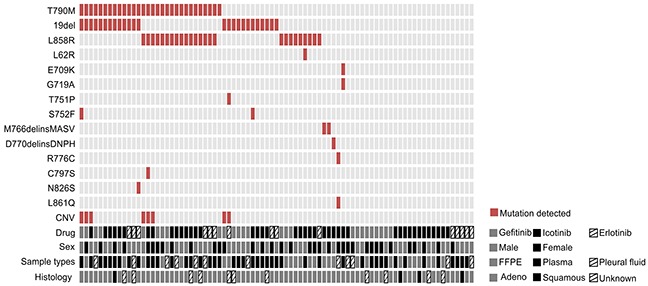
Figure 2. Comutation plot of EGFR mutations in 83 patients.

Each vertical line of blocks represents a patient. Patient features, including the drug they used, their sexes, tumor sample types that collected and histology types, were aligned below the mutation plot.
