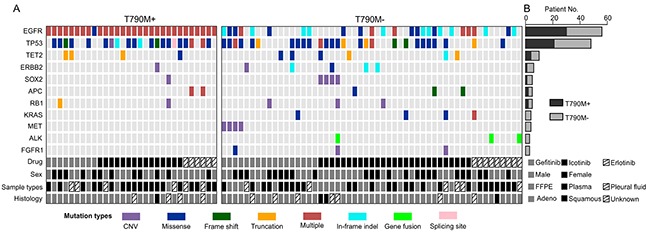
Figure 3. T790M+ and T790M- groups demonstrated different mutation spectrums.

A. Top 11 mutated genes (with at least 3 mutations identified in 83 patients) in T790M- group were selected and plotted against the T790+ group in order to compare the occurrence of different mutations between these two groups. Each vertical line of blocks represents a patient with patient features list at the bottom. Mutation types were differentiated by block colors. Multiple mutation types (red blocks) indicate that the patient have more than one mutations on the same gene. B. The number of mutated patients in T790M+ and T790M- groups was stacked for each gene. Each bar represents the gene on the left.
