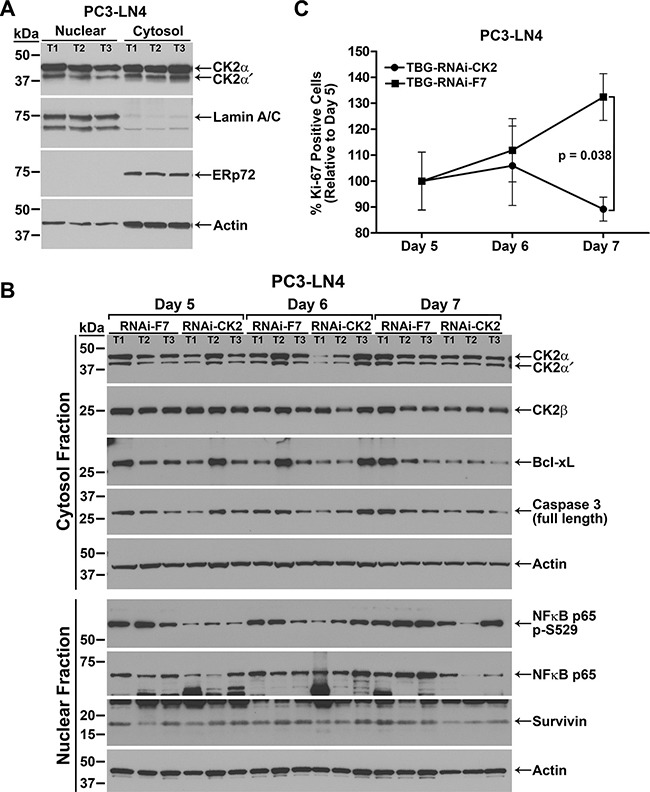
Figure 3. Response over time to TBG-RNAi-CK2 treatment in PC3-LN4 xenograft tumors.

(A) Verification of nuclear and cytosol protein fractionation from tumor tissue is shown by comparative immunoblot analysis of CK2αα′, lamin A/C, ERp72, and actin. T1, T2, and T3 labels indicate different tumors. Antibody sourcing information is listed in Materials and Methods. (B) Immunoblot analysis of fractionated PC3-LN4 tumor lysates following intravenous treatments of 0.01 mg/kg TBG-RNAi-CK2 or TBG-RNAi-F7 as indicated above the blots. The signals for three mice per group are shown, the proteins detected are indicated on the right, and the cell fraction and size markers are indicated on the left. Actin signal was used as the loading control. T1, T2, and T3 labels indicate different tumors within each treatment group. Antibody sourcing information is listed in Materials and Methods. (C) The percentage of Ki-67-positive tumor cells was determined from Ki-67-stained tumor sections. The percentage of Ki-67-positive cells on each day was expressed relative to day 5 (setting day 5 as 100%) and is shown graphically for each treatment. Mean and standard deviation are shown. Sample sizes: n = 6 for all groups except n = 7 for TBG-RNAi-F7 day 7.
