
Figure 5. Efficiency and verification of TBG nanocapsule delivery and detection of RNAi-CK2 oligomer released in xenograft tumors.
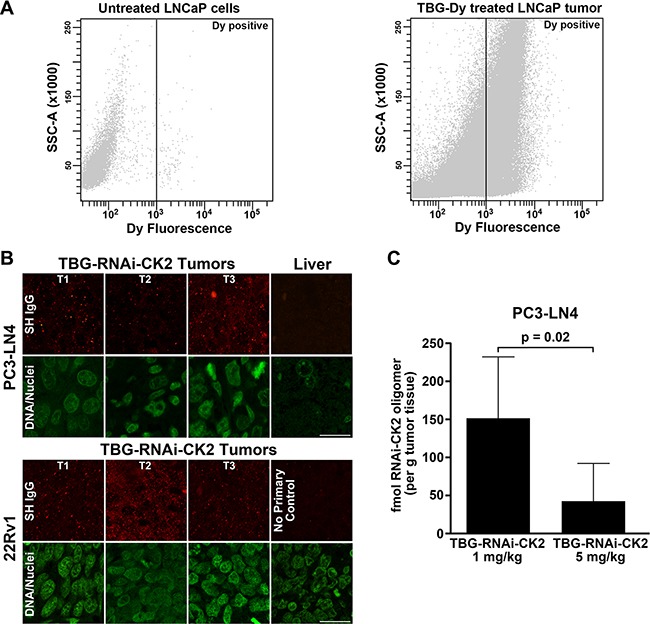
(A) FACS analysis of untreated LNCaP cells (left panel) and TBG-Dy treated LNCaP xenograft tumor cells (right panel). The position of the gate set to define Dy-positive cells is shown as a black line with Dy-positive events to the right of the line. (B) Tumor and liver sections from mice treated with TBG-RNAi-CK2 were collect 24 h post treatment (Day 5 for PC3-LN4; Day 11 for 22Rv1) and subjected to indirect immunofluorescence analysis for Syrian hamster IgG contained in the nanocapsules. Nuclei were counterstained with Sytox® Green. T1, T2, and T3 labels indicate different tumors. Scale bar is 20 μm. (C) The graph depicts the mean fmols of RNAi-CK2 recovered and detected by q-SL-RT-PCR in PC3-LN4 xenograft tumors. Mice were treated once by tail vein injection at the dose indicated under each bar. Means (n = 6 per group) are presented and error bars represent standard deviation. The p-value is indicated on the graph.