
Figure 2. PRIMA-1 treatment induces the activation of ER stress pathway/UPR.
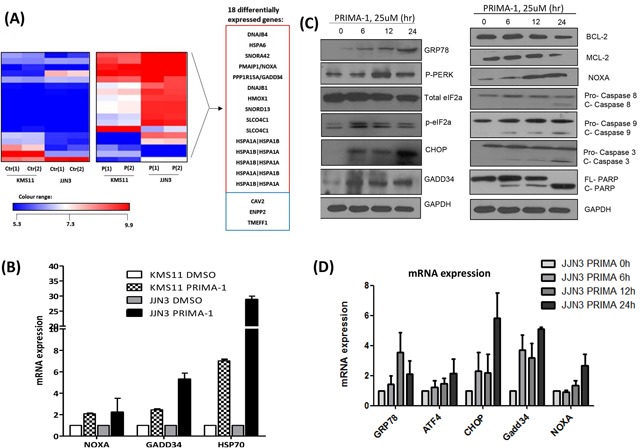
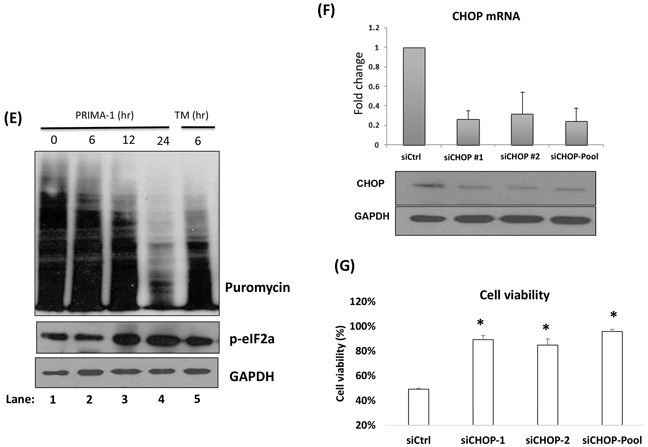
A. Heat map demonstrating the differentially expressed genes of the PRIMA-1 versus DMSO-treated samples in JJN3 and KMS11 (Fold change = 2, p < 0.05). The experiment was conducted in duplicates. Ctr(1): DMSO-treated sample 1, Ctr(2): DMSO-treated sample 2, P(1): PRIMA-1-treated sample 1, P(2): PRIMA-1-treated sample 2. Genes in red box: upregulated, genes in blue box: downregulated. B. Real time-PCR validation of GEP analysis revealed upregulation of NOXA, GADD34 and HSP70 upon 25uM PRIMA-1 treatment (24 hours). C. Western blot analysis of various ER stress and apoptotic markers in JJN3 treated with PRIMA-1 (25uM) at different time points. D. Real time-PCR analysis of ER stress markers in JJN3 treated with PRIMA-1 25uM at different time points. E. Newly synthesized proteins were labelled with puromycin in JJN3 cells after drug treatment (25uM) at different time points. TM: Tunicamycin. F. JJN3 was transfected with 100nM siCtrl or two independent sequences of siCHOP or combined sequences of siCHOP #1 and siCHOP #2 for 24 hours. mRNA and protein were isolated to check for knockdown efficiency. G. 24 hours post-CHOP knockdown, JJN3 cells were treated with 25uM PRIMA-1 for another 48 hours. Cell viability was quantified by MTS assay. * : p<0.05.