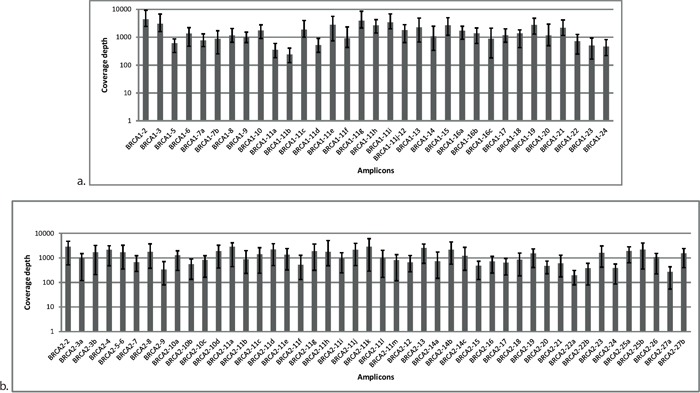
Figure 1. Distribution of coverage for each amplicon in BRCA1 a. and BRCA2 b. originating from Illumina MiSeq sequencing data.

Each amplicon was surveyed at multiple reference points. Average was calculated from 24 samples. Error bars represent the minimum and maximum values of coverage in the respective amplicon.
