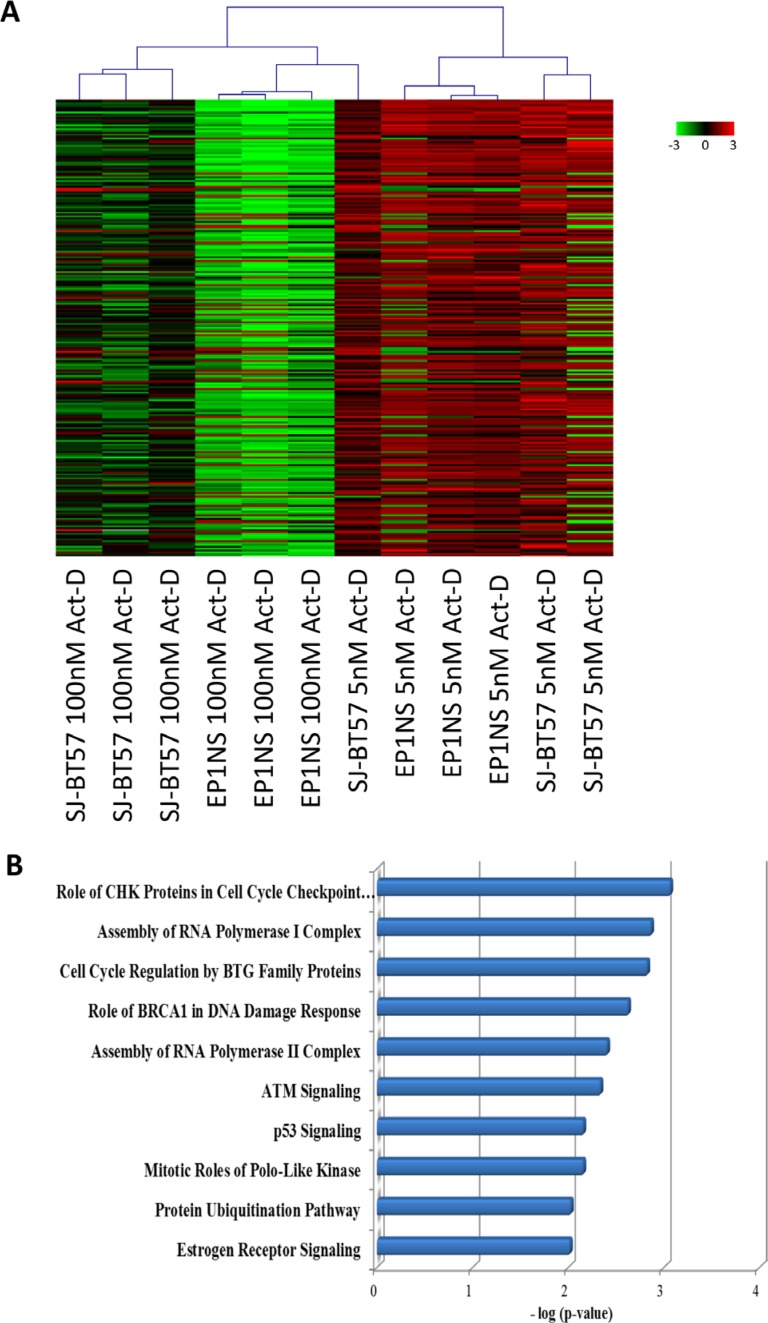
Figure 4.
(A) Gene expression profiling after high-dose (100 nM) and low-dose (5 nM) Actinomycin-D treatment of ependymoma cell lines, EP1NS (ST-EPN-RELA) and SJ-BT57 (PF-EPN-A). Unsupervised hierarchical clustering of top 300 differentially expressed genes revealed distinct transcriptome influences according to treatment. (B) Ingenuity pathway analysis of significant differentially regulated genes between high-dose (100 nM) and low-dose (5 nM) treatment of the cell lines pinpointed the p53 pathway as one of the top ten upregulated pathways after low-dose treatment.

