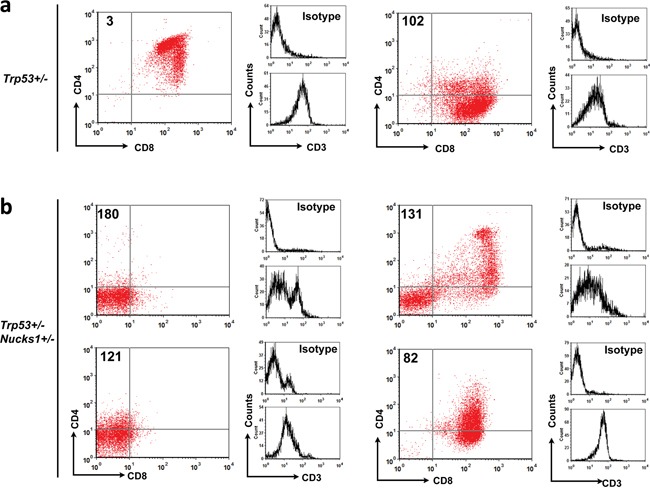
Figure 5. Immunophenotyping analyses of TL cells isolated from IR-induced TLs of Trp53+/− and Trp53+/− Nucks1+/− mice.

a. Primary TL cells from TLs of Trp53+/− mice were stained for CD4, CD8 and CD3 and analyzed by FACS. Representative 2-parameter dot plots showing that most primary TL cells from Trp53+/− mice were CD4+ CD8+ DP (TL-3) or CD8+ SP (TL-102) with moderate CD3 expression (see also Table 2). b. Same as in (a) for primary TL cells isolated from Trp53+/− Nucks1+/− mice. Note, that large compartments of CD4- CD8- DN TL cells were seen in TLs from Trp53+/− Nucks1+/− mice (TL-180, TL-121 and TL-131; see also Table 2).
