
Figure 2. Box plot representation of results of the 3 controls (RNS85, RNS175 and RNS96) tested by pyrosequencing (PSQ) and semi-quantitative Methylation-specific PCR sqMS-PCR.
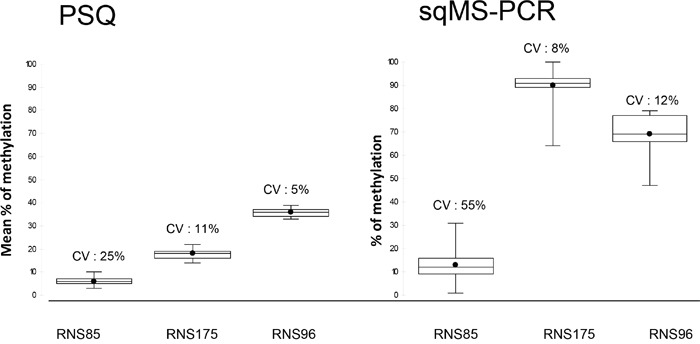
Each control was repeated at least in duplicate at each of the participating laboratories. The box plots depict the minimum and maximum values observed, the upper (Q3) and lower (Q1) quartiles (the length of the box represents the interquartile range), the median (identified by a line inside the box) and the mean (identified by the black point). Above each box the coefficient of variation (CV) estimates the interlaboratory reproducibility of the technique at the observed value.