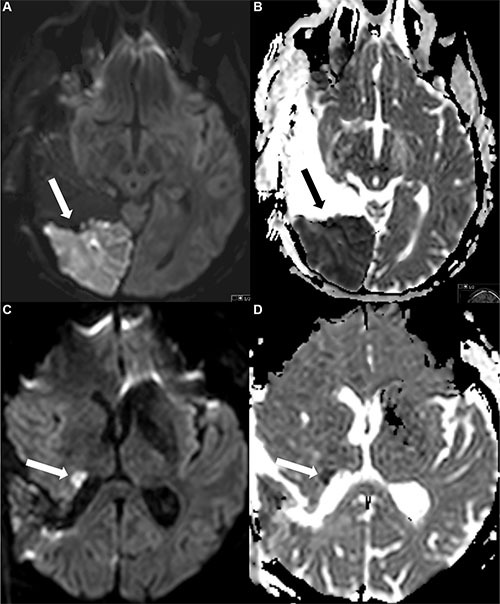
Figure 4. Examples of postoperative ischemic changes.

The first row (Figure A and B) shows a large area with restricted diffusion (A) and corresponding hypointensity in the ADC map (B), the second row a smaller area with restricted diffusion (DWI) (C) and ADC (D) map.
