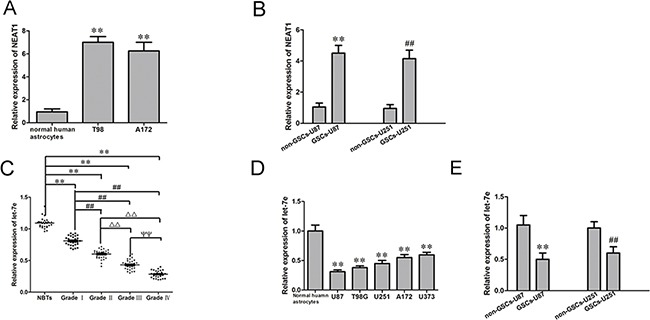
Figure 2. NEAT1 and let-7e levels in glioma tissues and GSCs.

A. Expression of NEAT1 in human normal astrocytes and glioma cell lines (n=5, each group). **P<0.01 vs. Normal human astrocyte group. B. Expression of NEAT1 in non-GSCs and GSCs (n=5, each group). **P<0.01 vs. non-GSC-U87 group; ##P<0.01 vs. non-GSC-U251 group. C. Expression of let-7e in glioma tissues of different grades and NBTs (n=30, each group). **P<0.01 vs. NBT group; ##P<0.01 vs. Grade I group; ΔΔP<0.01 vs. Grade II group;ΨΨP<0.01 vs. Grade III group. D. Expression of let-7e in human normal astrocytes and glioma cell lines (n=5, each group). **P<0.01 vs. normal human astrocyte group. E. Expression of let-7e in non-GSCs and GSCs (n=5, each group). **P<0.01 vs. non-GSC-U87 group; ##P<0.01 vs. non-GSC-U251 group. All data are presented as the mean ± SD
