
Figure 5. Binding and reciprocal repression between let-7e and NEAT1 determined GSC malignant behavior.
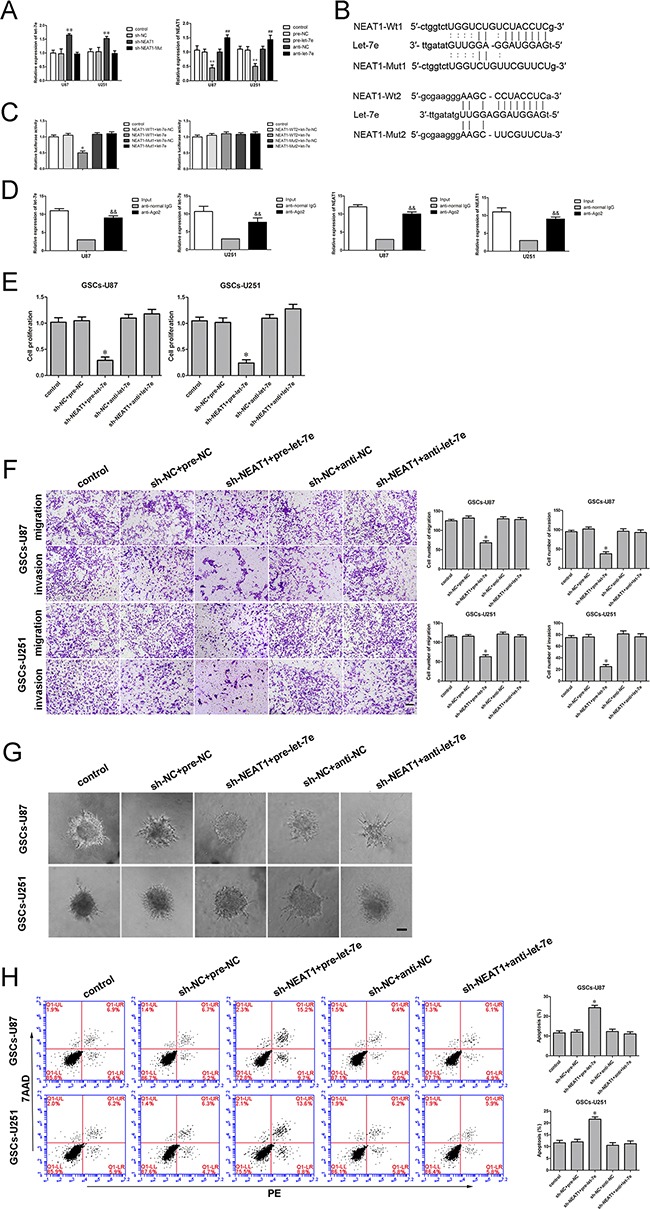
A. qRT-PCR analysis demonstrating the negative correlation between let-7e and NEAT1 expression in GSCs. **P<0.01 vs. sh-NC group; **P<0.01 vs. pre-NC group; ##P<0.01 vs. sh-NC group. B. NEAT1 harbored two putative let-7e binding sites; the designed mutant sequences are indicated. C. Dual-luciferase reporter assay of HEK 293T cells co-transfected with NEAT1-Wt1 (or NEAT1-Wt2) and let-7e-NC; NEAT1-Wt1 (or NEAT1-Wt2) and let-7e; NEAT1-Mut1 (or NEAT1-Mut2) and let-7e-NC; or NEAT1-Mut1 (or NEAT1-Mut2) and let-7e. *P<0.05 vs. NEAT1-Wt1+let-7e-NC group. D. Let-7e was identified in the NEAT1-RISC complex. NEAT1 and let-7e levels were measured by qRT-PCR. &&P < 0.01 vs. the anti-normal IgG group. E. The CCK-8 assay was applied to evaluate the effects of NEAT1 and let-7e on GSC proliferation. F. Quantification of the migration and invasion of GSCs in groups according to NEAT1 and let-7e expression. Representative images and accompanying statistical plots are presented. G. 3D Spheroid-based tumor migration assays of the effect of NEAT1 and let-7e co-transfection on GSC migration. Scale bars, 60 μm. H. Flow cytometry analysis of GSCs in groups according to NEAT1 and let-7e expression. *P<0.05 vs. sh-NC+pre-NC group. Scale bars, 20 μm. For A, C, D, E and H, data are presented as the mean ± SD (n=5, each group).