
Figure 6. NRAS was upregulated in glioma tissues, glioma cell lines and GSCs.
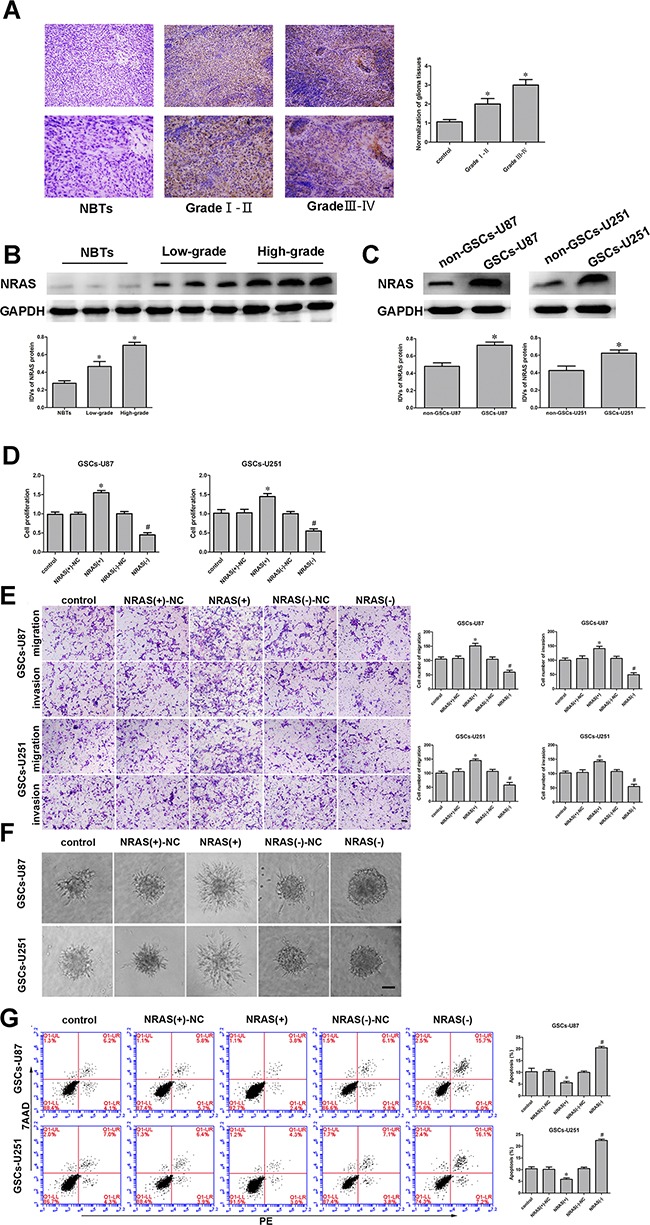
And NRAS promoted cell proliferation, migration and invasion and inhibited apoptosis of GSCs. A. Immunohistochemistry of NRAS protein levels in non-tumorous brain, Grade I-II glioma, and Grade III-IV glioma tissues. Original magnification: 100× (above), 200× (below). Scale bar, 50 μm. B. NRAS protein expression in non-tumorous brain tissues and glioma tissues, with GAPDH as an endogenous control. Representative protein expression and integrated light density values of NRAS in non-tumorous brain tissues, low-grade glioma tissues (WHO I-II), and high-grade glioma tissues (WHO III-IV) are shown. Data are presented as the mean ± SD (n=15, each group). *P<0.05 vs. non-tumorous brain tissue group. C. Western blot of NRAS expression in non-GSCs and GSCs, with GAPDH as an endogenous control. *P<0.05 vs. non-GSC group. D. The CCK-8 assay was employed to determine the effect of NRAS on GSC proliferation. E. Quantification of GSC migration and invasion upon NRAS inhibition. Representative images and accompanying statistical plots are presented. F. 3D Spheroid-based tumor migration assays of the effect of NRAS expression on GSC migration. Scale bars, 60 μm. G. Flow cytometry analysis of the effects of NRAS overexpression or downregulation on GSCs. Data are presented as the mean ± SD (n=5, each group). *P<0.05 vs. NRAS (+)-NC group; #P<0.05 vs. NRAS (−)-NC group. Scale bars, 20 μm.