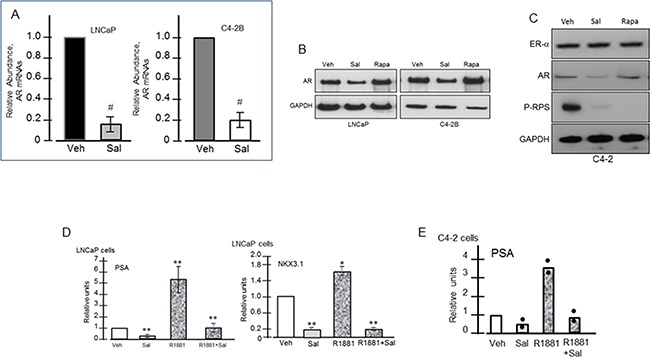
Figure 4. Reduced expression of AR and AR-targeted genes in response to salinomycin.

Cells were treated with Sal (400 nM) for 20 hrs. A. QRT-PCR of AR mRNAs; # p<0.05. B. Western blot assay of AR. C. ERα, AR, P-RPS levels in C4-2 cells. D, E. PSA and Nkx3.1 mRNA levels in LNCaP (D, E) and C4-2 (D) cells; * p<0.05; ** p<0.01. Each bar graph is the average of two independent assays. For E, points represent individual values.
