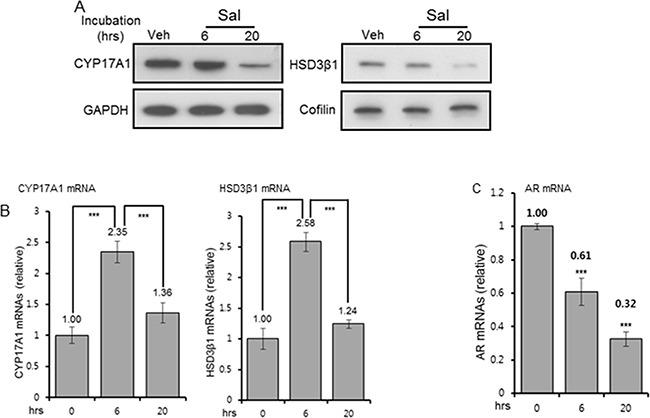
Figure 6. Reduction of CYP17A1, HSD3β1 and AR levels.

A. CYP17A1 and HSD3β1 protein levels in C4-2 cells treated for 6 and 20 hours with 400 nM Sal. GAPDH (37kDa) and cofilin (20kDa) were internal controls for CYP17A1 (57kDa) and HSD3β1 (42kDa), respectively. For each, the same blot, cut in two segments, was used to probe the antigen of interest and internal control antigen. Control C4-2 cells were vehicle-treated for 20 hours. B, C. QRT-PCR of CYP17A1, HSD3β1(B), and AR (C) mRNAs, normalized to constant GAPDH mRNAs. Each bar graph is average of three biological replicates. For technical replicates, values from duplicate wells were averaged. *** p<0.001.
