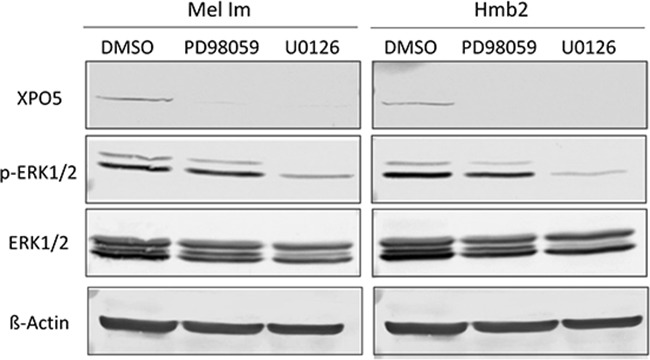
Figure 3. Analysis of potential regulators of XPO5 protein expression.

Western blot analyses after the treatment of the melanoma cell lines Mel Im and Hmb2 with the MEK inhibitors PD98059 and U0126 showed a strong downregulation of XPO5 expression. The p-ERK1/2 staining reflects inhibition of ERK phosphorylation by U0126 treatment in both cell lines compared with the control treatment (DMSO). ERK1/2 antibody staining was used to show overall ERK level. ß-Actin was analyzed in the same protein samples on a second blot (due to similar molecular weights) and served as a loading control.
