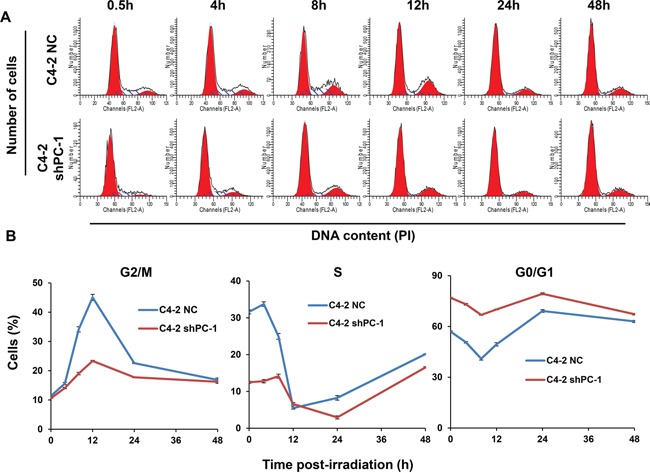
Figure 5. Cell cycle distribution after irradiation.

A. Representative histograms of flow cytometry of C4-2 NC and C4-2 shPC-1 cells at different times after 4-Gy γ-ray irradiation. B. Quantitative data of proportion of cells in G2/M, S or G0/G1 phases at different times after irradiation. Data are means ± standard deviations from three independent experiments.
