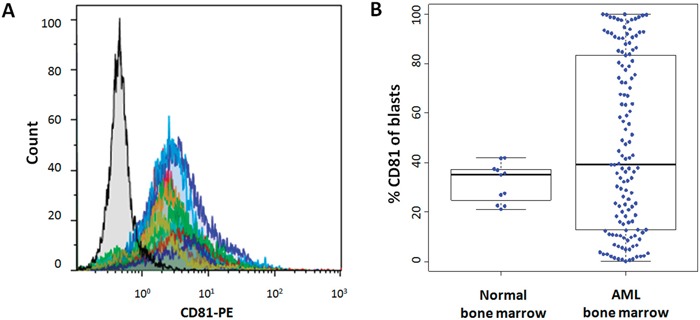
Figure 1. CD81 expression on normal and AML blast cells.

A. Normal bone marrow sample overlay of mean fluorescence intensity histograms of CD81 on blast cells. Isotype control is colored in black. B. Comparison of CD81 expression on blast cells between normal bone marrow samples (n=11) and diagnostic bone marrow from patients with de novo AML (n=134).
