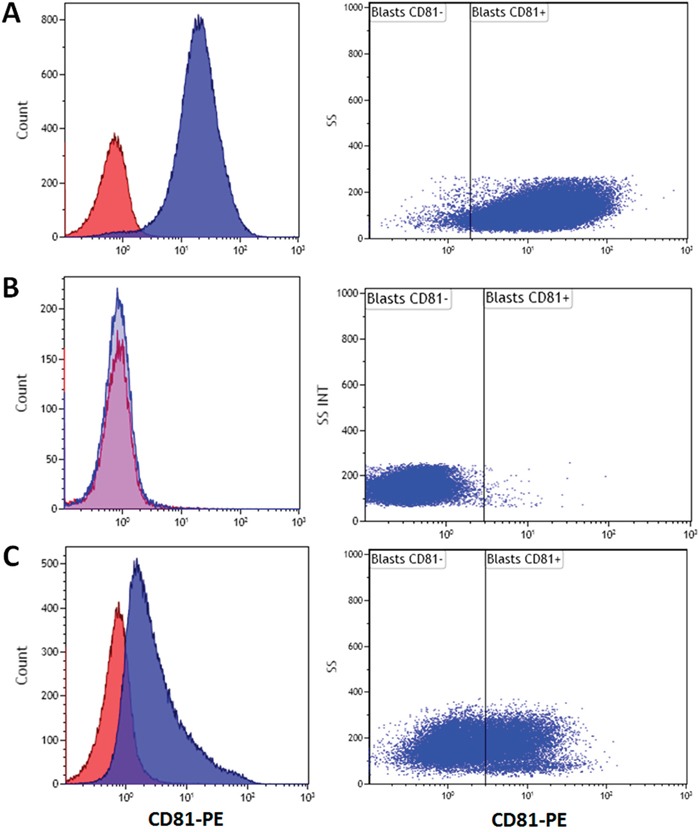
Figure 2. Primary AML have varying CD81 expression on blast cells.

Representative examples of mean fluorescence intensity histograms of different types of AML according to CD81 expression: A. Example of high CD81 blast expression (CD81++) B. Example of negative CD81 blast expression (CD81−); C. intermediate CD81 blast expression (CD81+). Isotype control corresponds to the red histogram.
