
Figure 4. Binding properties of CXCL12 and [3-NT7]CXCL12 to CXCR4 and ACKR3.
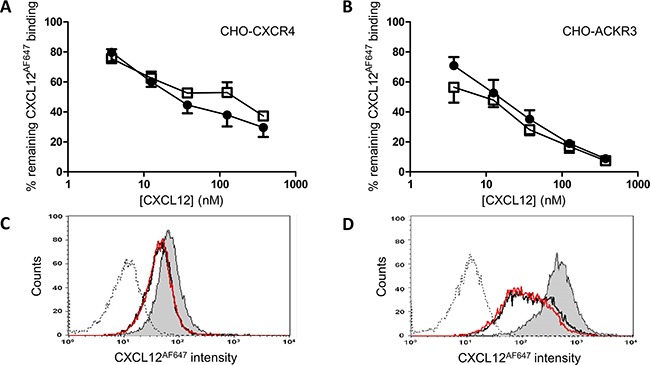
CXCL12 (•, filled circles) and [3-NT7]CXCL12 (□, open squares) were added (concentrations ranging from 3.75nM to 375nM) to CHO-CXCR4 cells (panel A) or CHO- ACKR3 cells (panel B), together with 12.5nM CXCL12AF647 while the cells were kept on ice during the one hour incubation period. The results shown are the mean percentages (±SEM) of fluorescence compared to the control where only CXCL12AF647 was added to the cells (n=8 for the CXCR4 experiments, n=4 for ACKR3). Statistical comparison between CXCL12 and [3-NT7]CXCL12 was performed using the Mann-Whitney U test. Panels C and D show FACS data from a representative experiment with CHO-CXCR4 and CHO-ACKR3, respectively. The remaining fluorescence of CXCL12AF647 after competition with 37.5nM CXCL12 (black line) or 37.5nM [3-NT7]CXCL12 (red line) are represented by two almost completely overlaying curves. The histogram where only CXCL12AF647 was added to the cell (grey area) shows the maximal fluorescence signal. The unstained control is also shown (dotted line).