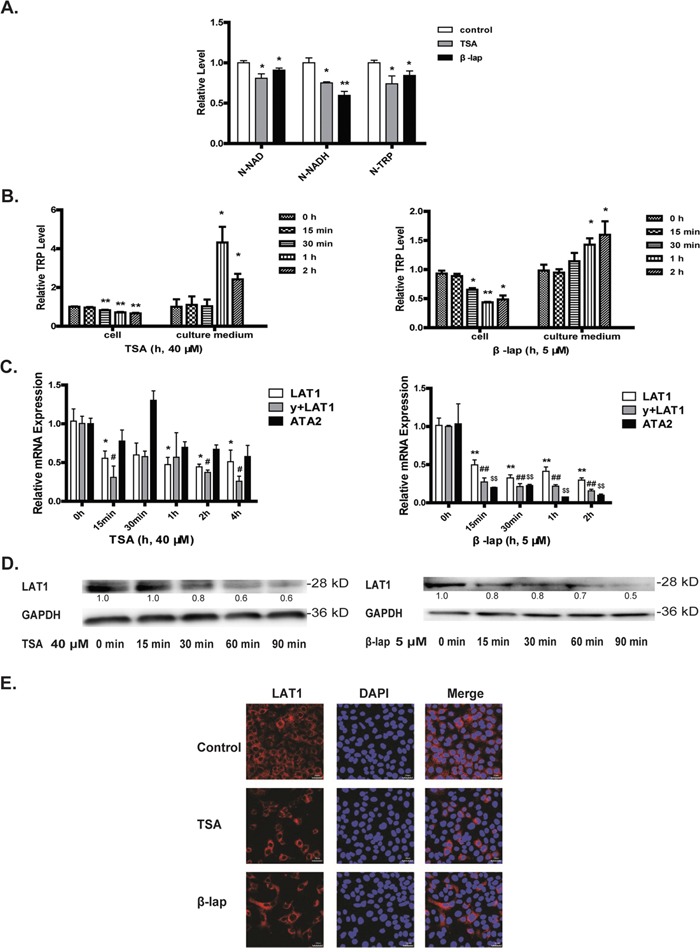
Figure 4. Decreased tryptophan transport explains NAD+ depletion.

A549 cells were treated with TSA (40 μM) or β-lap (5 μM, 2 h withdraw). The intracellular N-NAD, N-NADH, and N-TRP in A549 cells supplemented with isotope labeled tryptophan and treated with drugs for 4 h A. The levels of tryptophan in the cells and culture medium were detected by LC-MSn B. The mRNA levels of several tryptophan transporters (LAT1, y+LAT1, ATA2) C. The protein levels of LAT1 assessed by western blot assays D. and confocal microscope with drug exposure of 1 h E. (*P<0.05, **P<0.01, TSA or β-lap treatment compared with control group; #P<0.05, ##P<0.01, y+LAT1 mRNA expression with TSA or β-lap treatment compared with control group; $P<0.05, $$P<0.01, ATA2 mRNA expression with TSA or β-lap treatment compared with control group).
