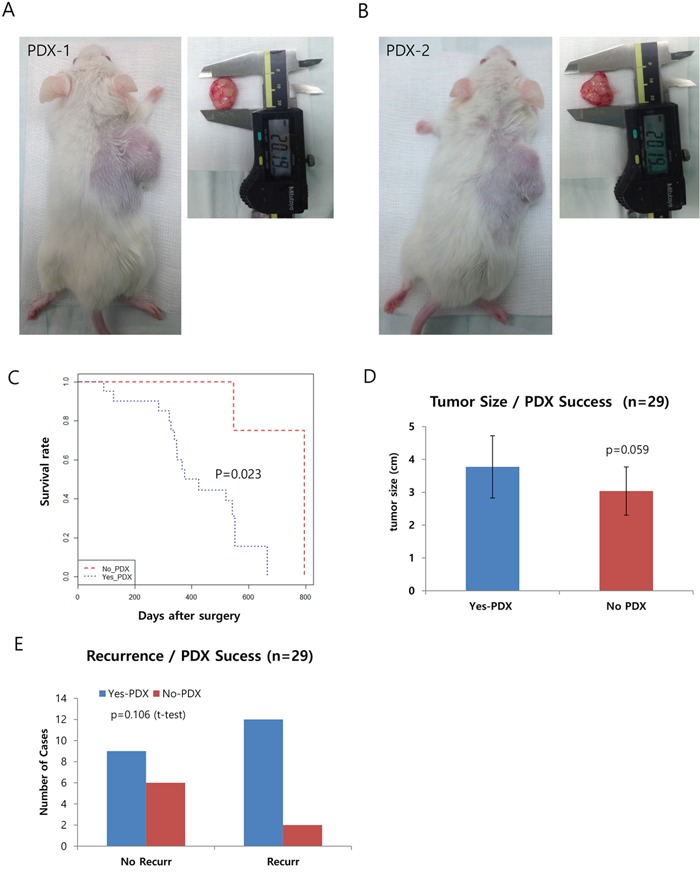
Figure 1. Generation of pancreatic patient-derived xenografts (PDXs) and the clinical features affecting their success.

A-B. Representative pictures of PDXs in NOD/SCID mice. The right panels show the dissected tumors being measured with calipers. C. Kaplan-Meyer curve of the two groups of successful xenograft (Yes PDX in Blue) or failed xenograft (No PDX in Red). D and E. Graphs showing a positive correlation between the success of the xenograft and other clinical factors, including survival (D) and recurrence (E).
