
Figure 4. ROS suppressive function of SOCS1 as revealed by analysis of intracellular ROS levels upon SOCS1 or shSOCS1 transduction.
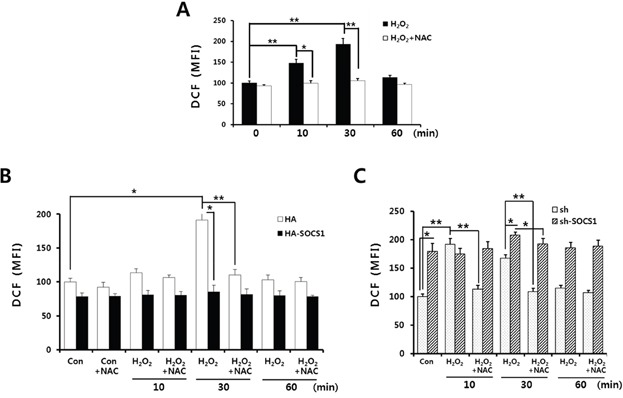
Cells were stimulated with H2O2 in the absence or presence of NAC pretreatment for 1 h. H2O2 treatments were done for indicated times and analysis of intracellular ROS levels was performed for parental HCT116 p53 +/+ A., HCT116 p53 +/+ HA & HA-SOCS1 B., and sh & sh-SOCS1 C.