
Figure 3. Characterizations of nanomedicines including NPs A, C, E, F. and micelles B, D, E, F.
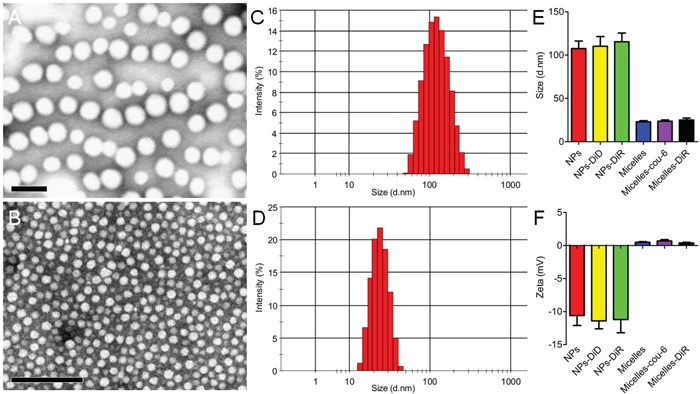
TEM photograph of (A) NPs and (B) micelles stained with 2% phosphotungstic acid. Bar: 100 nm. The size distribution of (C) NPs and (D) micelles analyzed with a Malvern Nano ZS. (E) Size and (F) Zeta potential of different types of NPs and micelles (n=3).