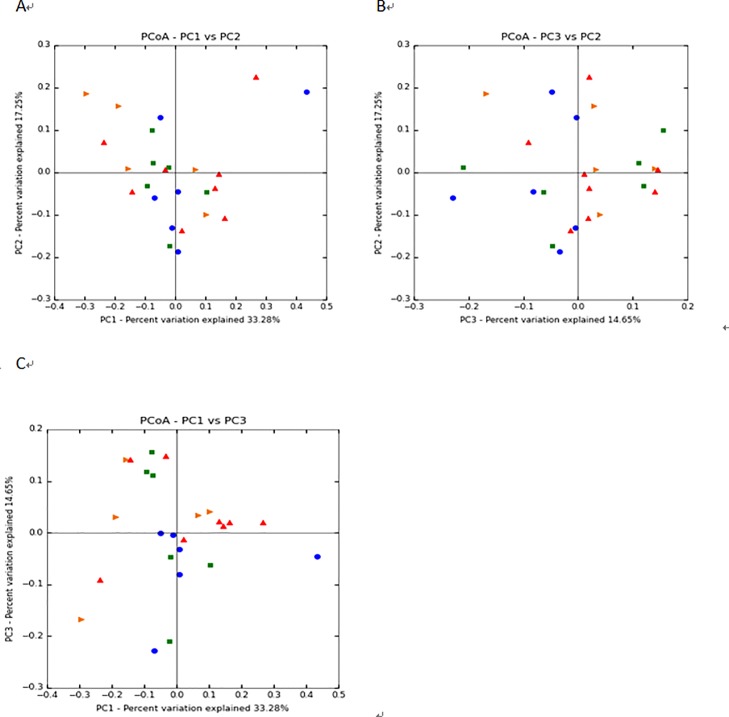
Fig 2. PCoA based on the UniFrac distance metric.
To evaluate similarities between bacterial communities, graphs A, B, and C were generated using OTUs, based on the UniFrac distance metrics PC1 and PC2, PC3 and PC2, and PC1 and PC3 (on a two-dimensional array), respectively. Samples from each treatment group are represented as follows: ►, HN45; ■, HN75; ▲, LN45; and ●, LN75. HN45 and HN75 represent samples obtained from Huanjiang mini-pigs fed the higher-nutrient diet for 45 and 75 days, respectively. LN45 and LN75 indicate samples obtained from those given the lower-nutrient diet for 45 and 75 days, respectively.

