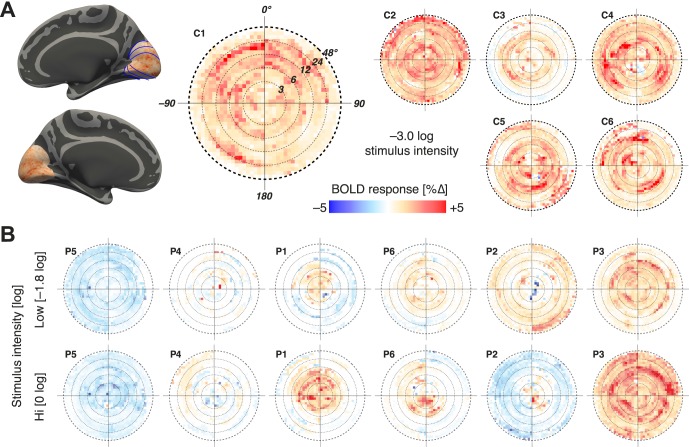
Figure 2.
Visual field projections of cortical response. (A) Left: The cortical response within visual areas V1 to V3 to stimulation at −3.0 log intensity is shown for a control observer (C1). The borders of visual areas are shown with thin blue lines. This cortical response (averaged across visual areas) is projected to a visual field representation with logarithmic eccentricity spacing. A roughly uniform, positive response to the stimulus is seen. The same measure for five other control subjects (C2–C6) is shown to the right. (B) The same visual field projection is shown for the six GUCY2D-LCA observers (P1–P6), at two stimulus intensity levels (−1.8 log and 0 log), each of which is higher than used for the controls. Subjects ordered by the relative magnitude of response.

