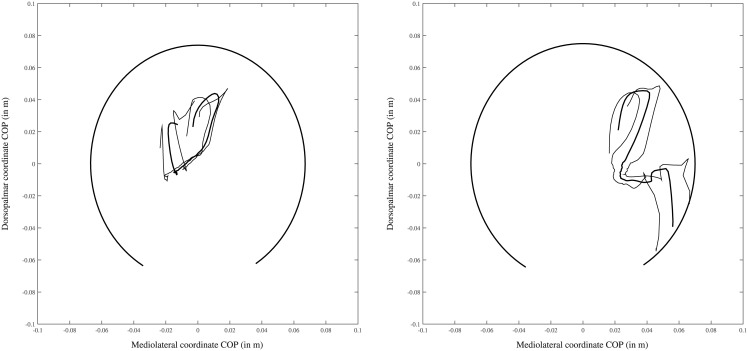
Fig 4. Example file of one of the three “exception” horses in which the correlation in the fore-aft direction is low.
The thick line shows the mean COP path over three trials, while the thinner lines show the mean ± standard deviation. The thick black line shows a partial ellipse drawn based on the hoof dimension of this limb to demonstrate relative position of the COP path in a hoof-bound coordinate system.

