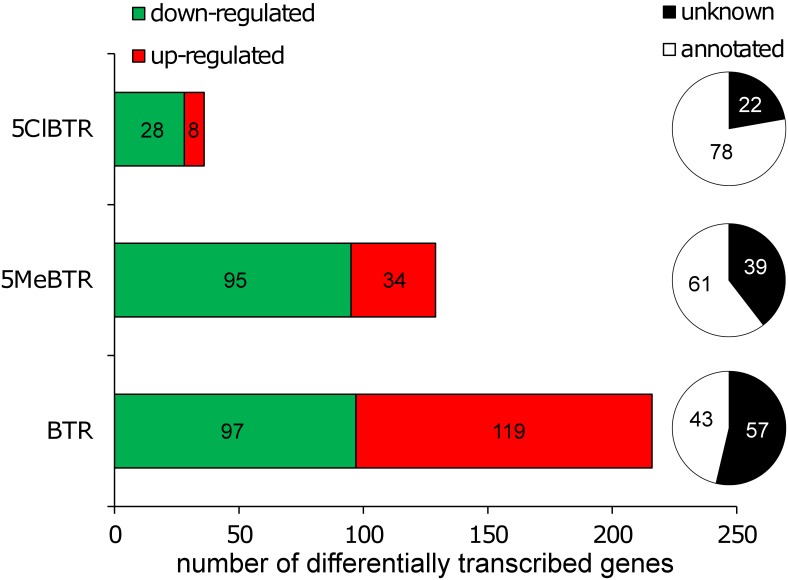
Fig 3. Number of significantly up- and down-regulated genes by 21-d exposure to 2 mg/L of BTR, 5MeBTR and 5ClBTR in D.magna measured by RNA-seq (logFC±2, p<0.05).
Pie charts indicate the percentage of differentially transcribed genes with and without a predicted function from blastx annotation searches.

