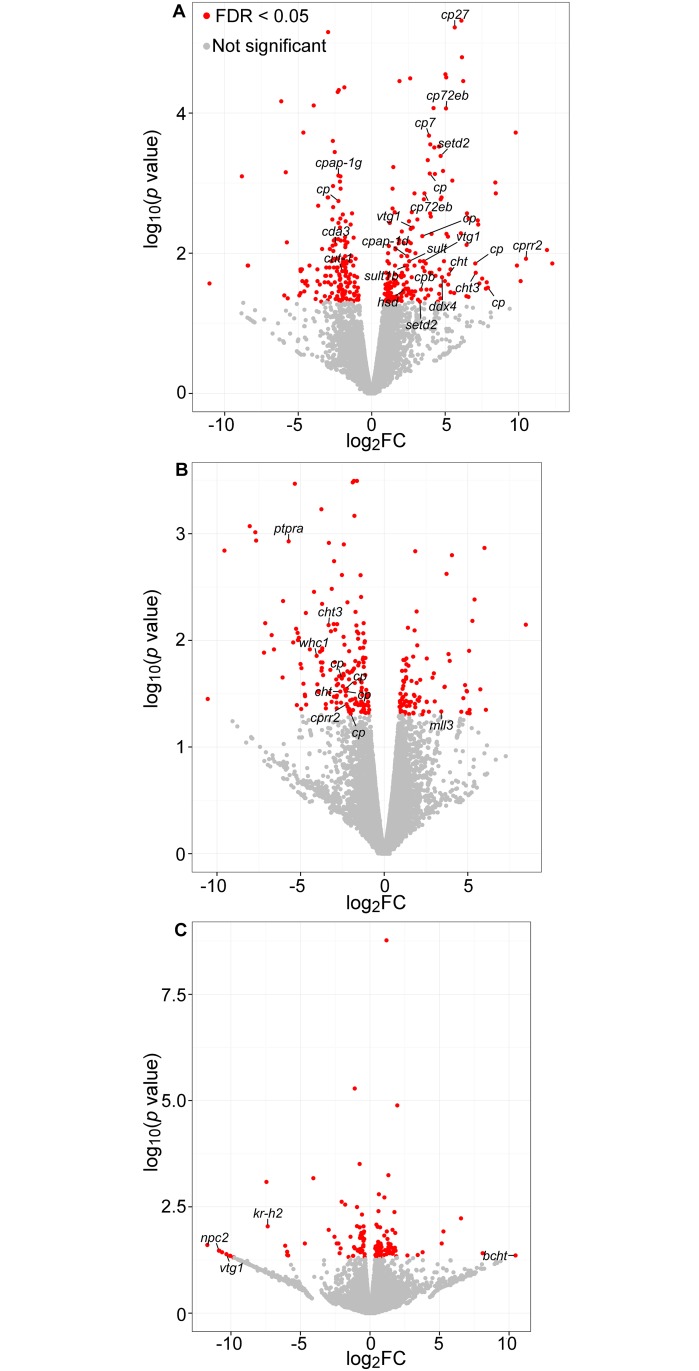
Fig 4. RNAseq data showing up- and down-regulated genes (x axis represents positive and negative fold changes, respectively) in D. magna exposed to 2 mg/L of (A) BTR, (B) 5MeBTR and (C) 5ClBTR.
Genes highlighted in red are significantly differentially transcribed between exposed and control samples (log2FC ± 2, p<0.05). Annotated genes with a predicted function related to molting and 20HE-mediated processes are indicated. Acronym definition can be found in S6 Table.

