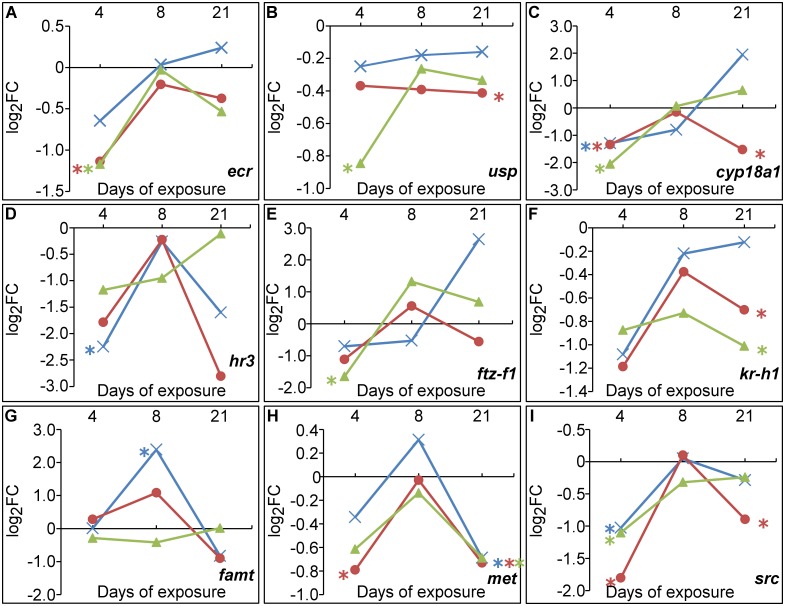
Fig 6. Transcription levels of selected genes related to molting and endocrine-mediated pathways in D. magna exposed to 2 mg/L of BTR (), 5MeBTR () and 5ClBTR () for 4-, 8- and 21d.
(A) ecr, (B) usp, (C) cyp18a1, (D) hr3, (E) ftz-f1, (F) kr-h1, (G) famt, (H) met, (I) src. Gene transcription values are indicated in log2FC from qRT-PCR measurements. * indicates a significant difference from the corresponding control (p<0.05).

