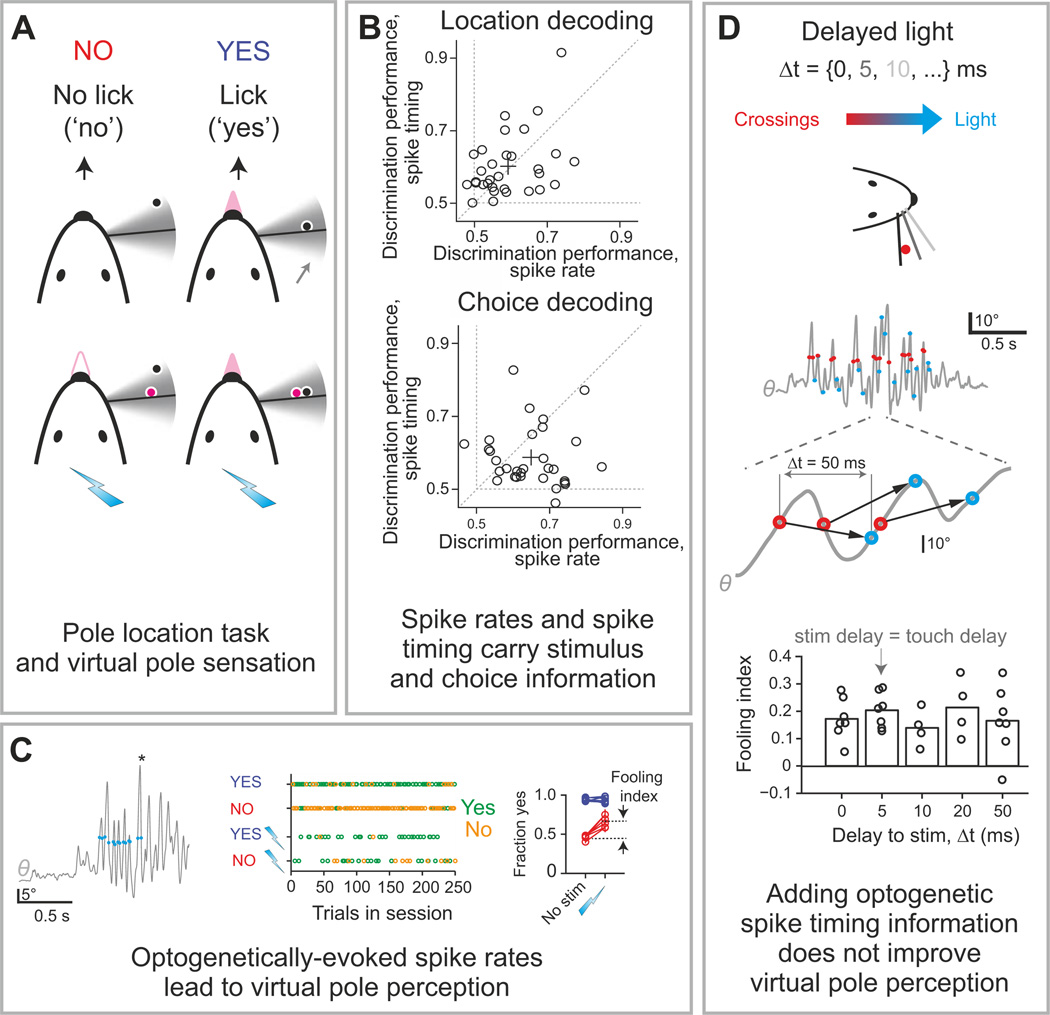
Figure 7. Examples of statistical and interventional intersection measures with sensory and illusory touches.
This figure shows results of the statistical and interventional test of the role of cortical spike timing and spike count in the neural code for whisker-based object location. The test involved closed-loop optogenetic stimulation causing illusory perception of object location. A) Schematic of the task: four trial types during a closed-loop optogenetic stimulation behavior session depending on pole location and optogenetic stimulation (cyan lightning bolts). A “virtual pole” (magenta) was located within the whisking range (gray area). Mice reported object location by licking or not licking. B) Decoding object location and behavioral choice from electrophysiologically recorded spikes in layer 4 of somatosensory cortex. Each dot corresponds to the decoding performance (fraction correct) of one neuron. C) Optogenetically-imposed spike rates evoked virtual pole sensation. Left: Optogenetic stimulation (blue circles) coupled to whisker movement (gray, whisking angle θ) during object location discrimination. Asterisk, answer lick. Middle: Responses in the four trial types across one behavioral session. Green, yes responses; gold, no responses. Right: Optogenetic stimulation in NO trials (red), but not in YES trials (blue), in barrel cortex increases the fraction of yes responses. Lightning bolt and “no stim” labels indicate the presence and absence of optogenetic stimulation, respectively. Error bars, s.e.m. Each line represents an individual animal. D) Adding timing information in the optogenetically evoked activity did not improve virtual pole perception. Top: delayed optogenetic stimulation was triggered by whisker crossing with variable delays, Δt. Middle: whisker movements with whisker crossing (red circles) and corresponding optogenetic stimuli (cyan circles) for Δt=50 ms. Bottom: fooling index (fraction of trials reporting sensing of a virtual pole) as function of Δt. Modified with permission from (O'Connor et al., 2013).

