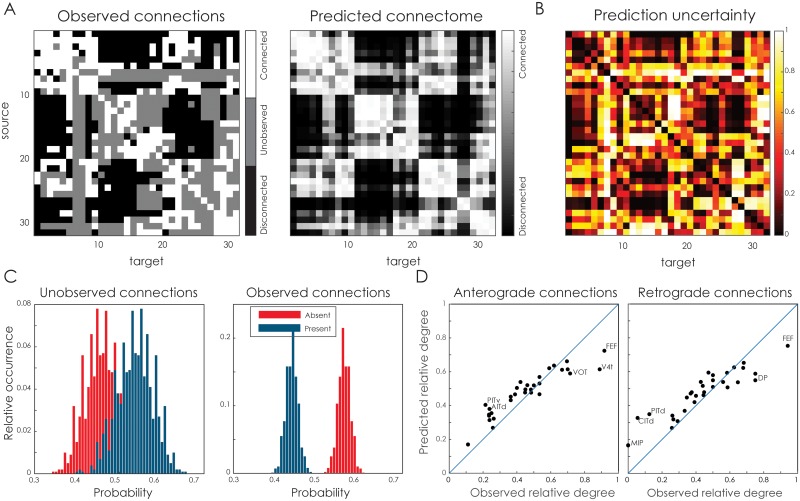
Fig 6. Macaque visual system connectivity.
A. The observed tracing data (left) [44], the corresponding predicted connectome (right), based on the 2D latent space model. B. The uncertainty associated with each of the predicted connections, indicated by the width of the 95% credible interval for the most uncertain class (see text). C. The predicted fraction of absent and present edges for either unobserved connections (left panel) or observed connections (right panel). D. The observed versus the predicted relative degree of the nodes in the network, for anterograde connections (left panel) and retrograde connections (right panel). The top five nodes with the largest differences in relative degree have their labels shown. A full listing is provided in S1 Appendix.

