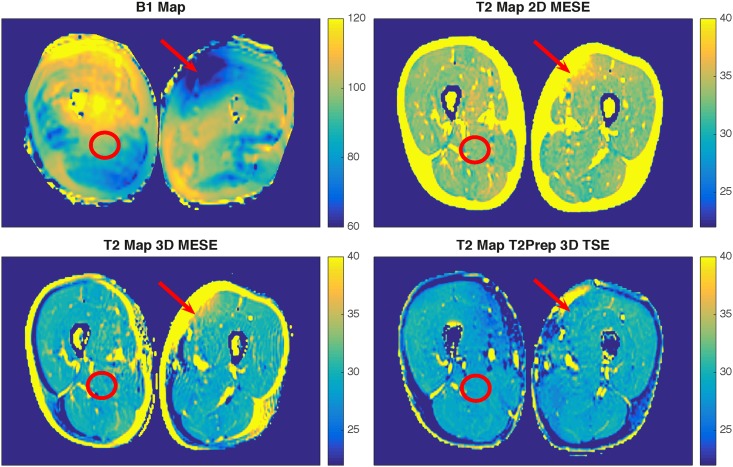
Fig 3. Representative example of B1 map and the three different T2 maps.
B1 map (top left) and the three different T2 maps (top right: T2prep 3D TSE, bottom left: 2D MESE, bottom right: 3D MESE) of the thigh musculature of one representative subject. With low B1 (arrow), 2D MESE and 3D MESE are significantly affected. With a small B1 error (circle), 2D MESE shows higher T2 values than 3D MESE and T2prep 3D TSE.

