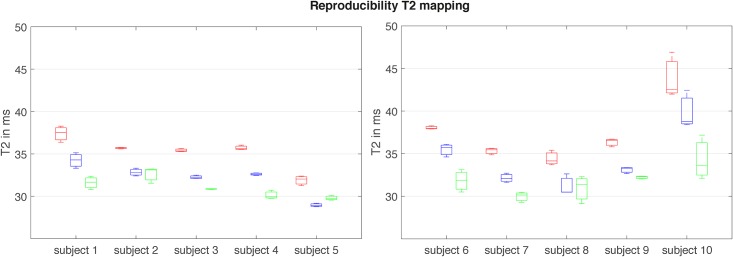
Fig 5. Reproducibility of the T2 values across 10 subjects.
Reproducibility of the T2 values assessed by the three different T2mapping methods across 10 scanned subjects in the left rectus femoris muscle. Boxes represent the 25th and 75th percentiles with the median represented by a horizontal line within the box plots. The bars indicate the minimum and maximum. Red: 2D MESE, blue: 3D MESE, green: T2prep 3D TSE.

